Unlocking Hidden Profit: A Step-by-Step Guide to Calculating 3D Configurator ROI

Investing in 3D technology should be a calculated business decision, not a leap of faith. To help you visualize the financial impact of 3D configuration, we developed a 10-step diagnostic tool.
Below is a step-by-step guide on how the calculator works and what the resulting data means for a typical $1.5M business.
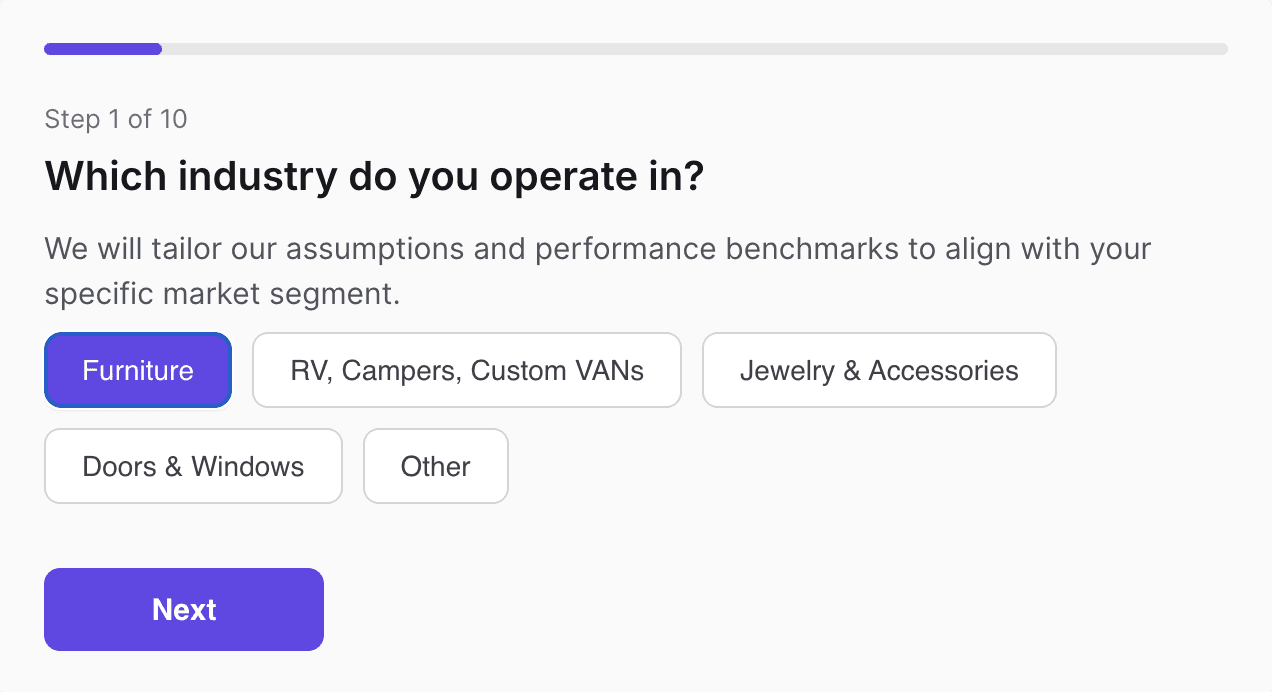
Step 1: Industry selection
We begin by identifying your market. This selection allows the model to apply industry-specific benchmarks for conversion rates and buyer behavior.
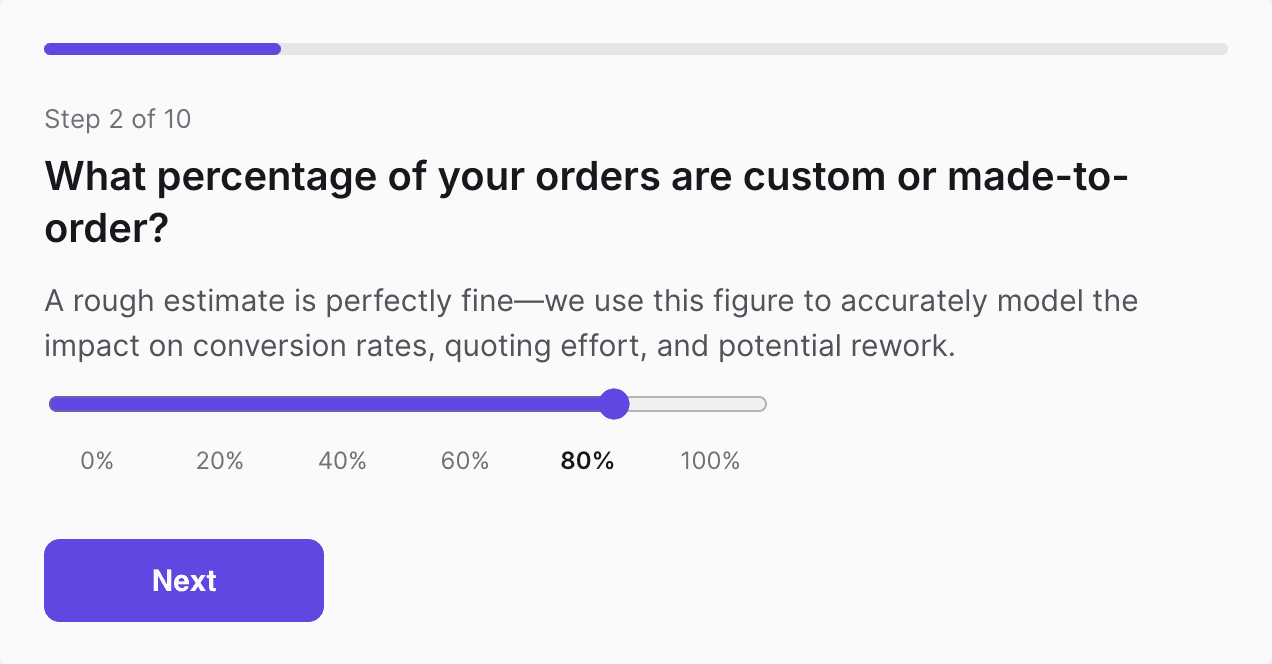
Step 2: Customization ratio
We move to the complexity of your catalog. In this case, we’ve set it to 80%. High customization typically leads to high quoting friction — the more custom the order, the more time a human spends quoting it.
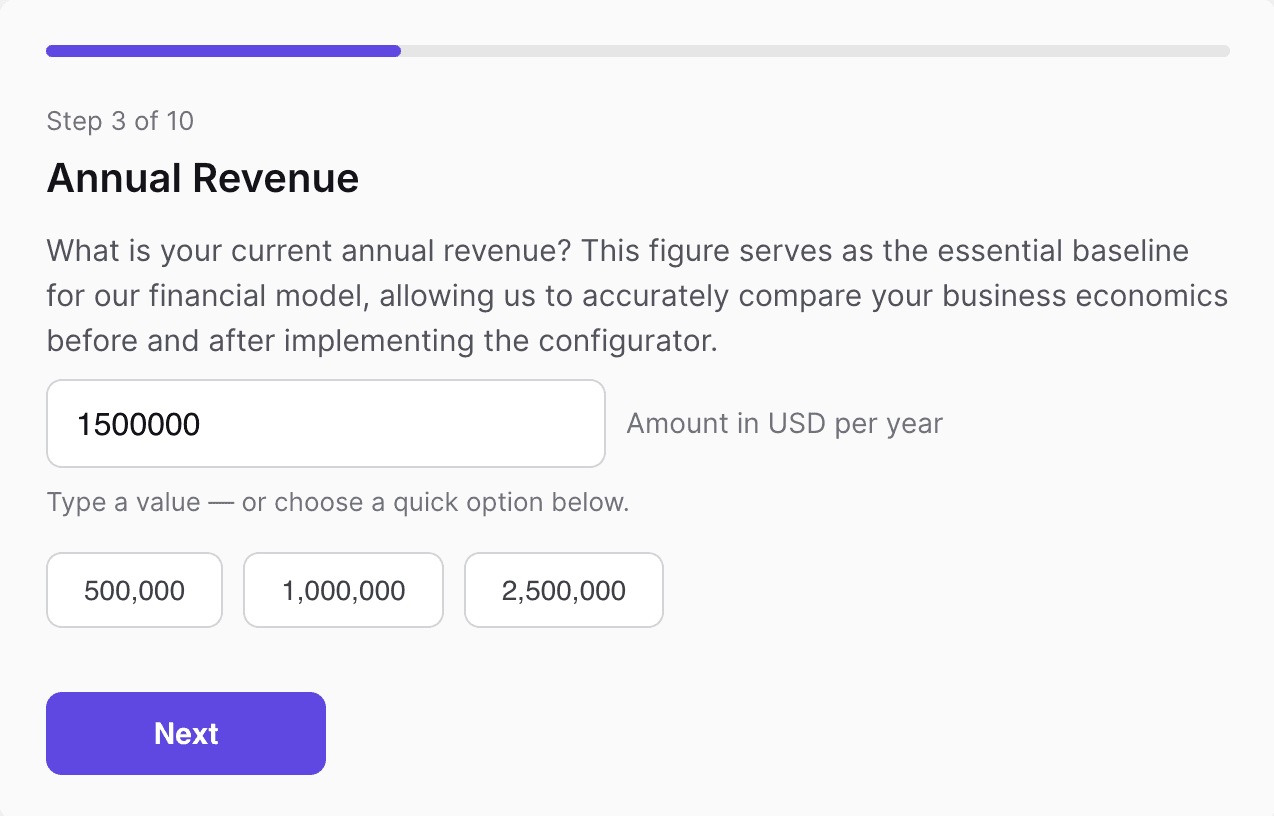
Step 3: Annual revenue baseline
We establish your current scale. For this example, we use a baseline of $1,500,000 in annual revenue. This serves as the "before" snapshot.
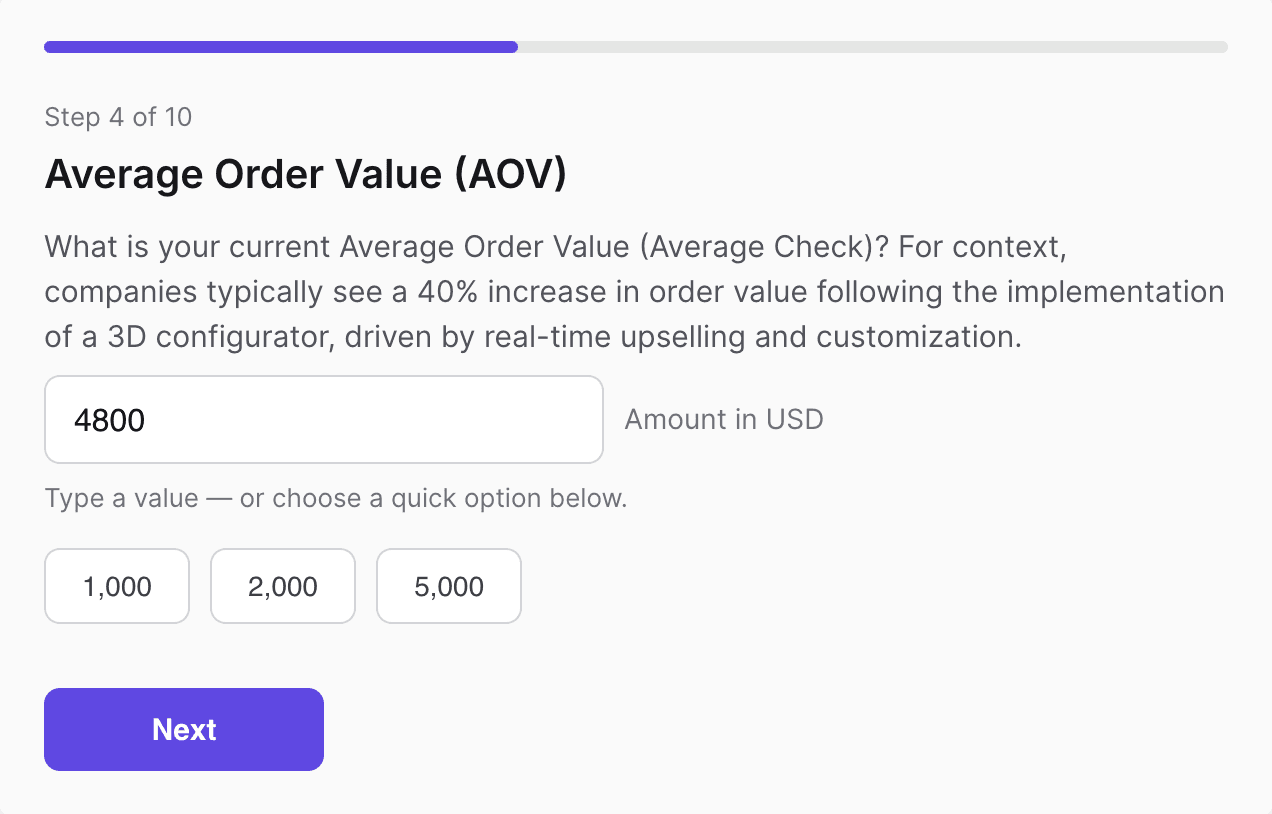
Step 4: Average Order Value (AOV)
We input the current average check: $4,800. A 3D configurator often increases this number by up to 40% through real-time upselling of premium features.
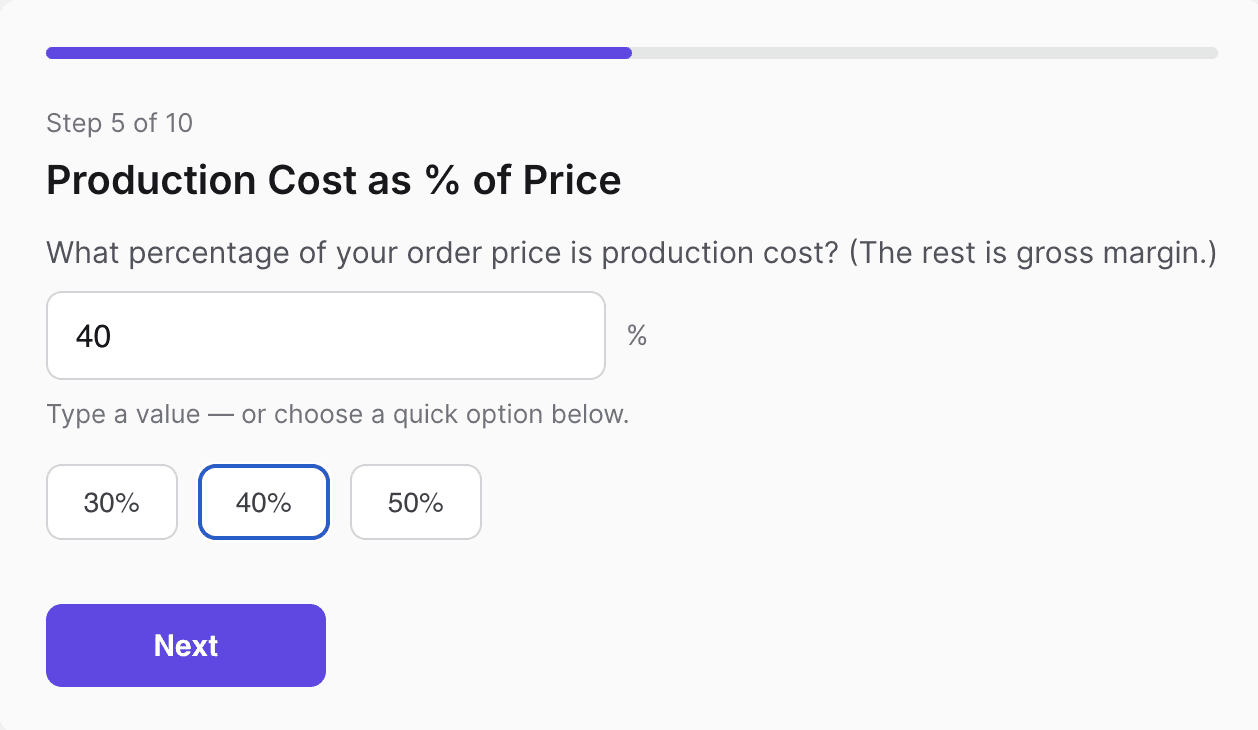
Step 5: Production costs
We define the margin. Here, 40% of the price goes toward production costs. The remaining 60% is the gross margin we are looking to protect from errors and inefficiencies.
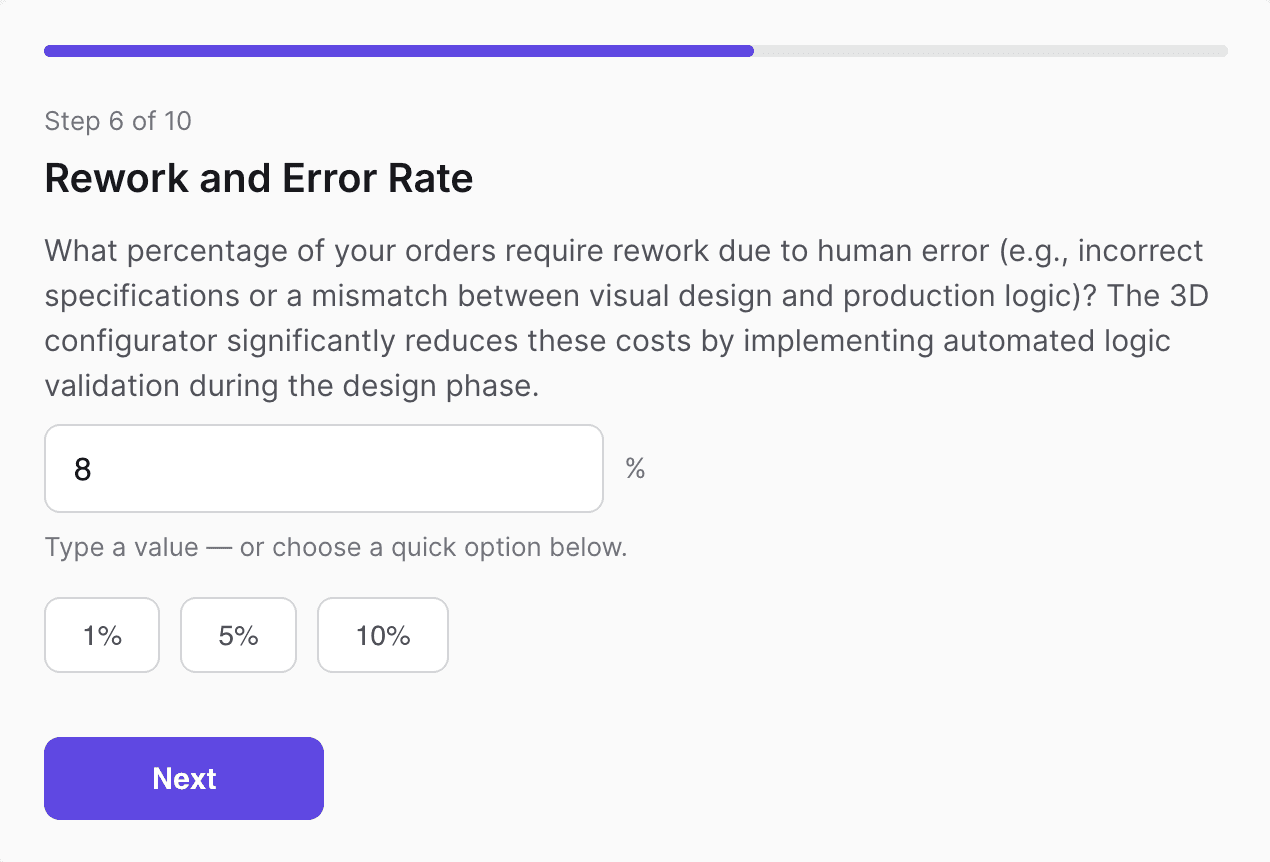
Step 6: The "error tax" (rework rate)
We account for human error. An 8% rework rate is used here, representing the cost of orders that must be fixed or rebuilt due to incorrect specifications during the manual sales process.
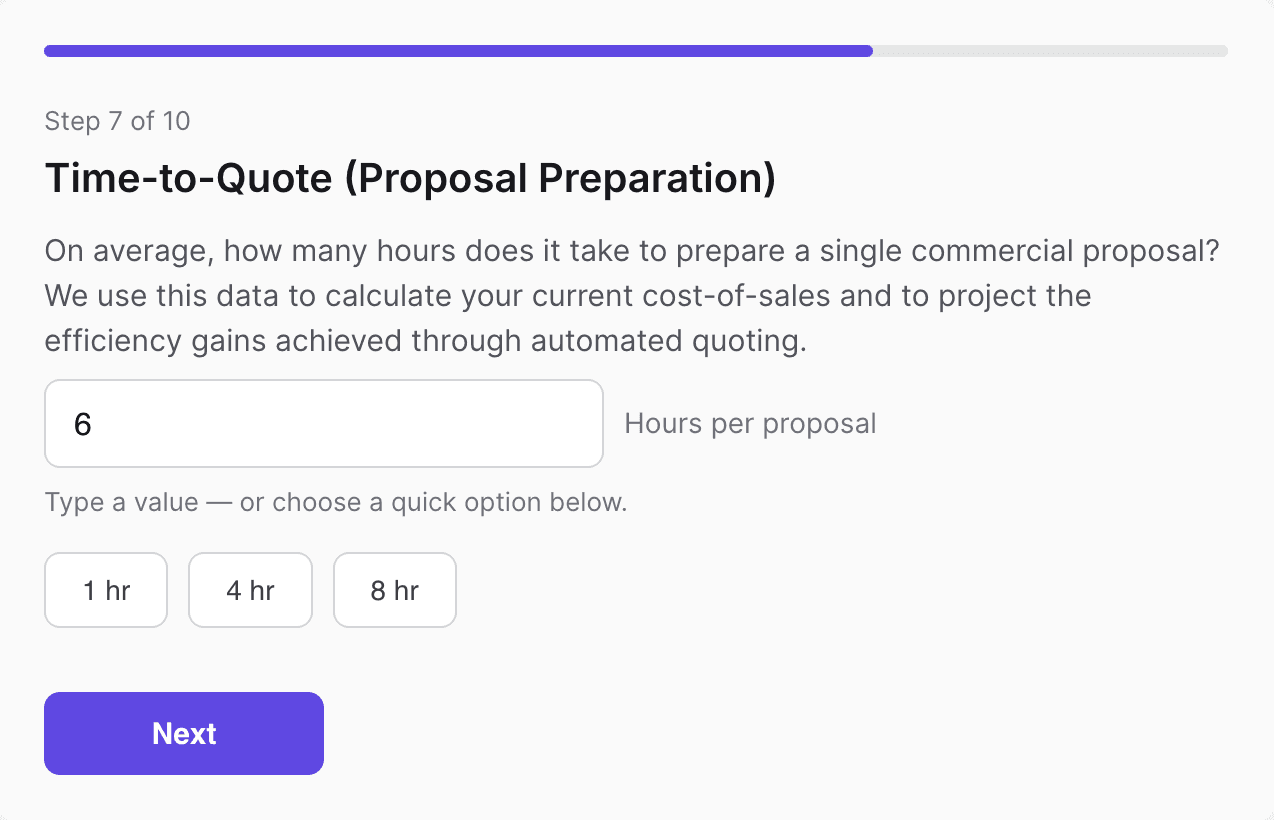
Step 7: Time-to-quote
This measures labor. It currently takes 6 hours to prepare a single commercial proposal. This is the primary bottleneck for scaling sales volume.
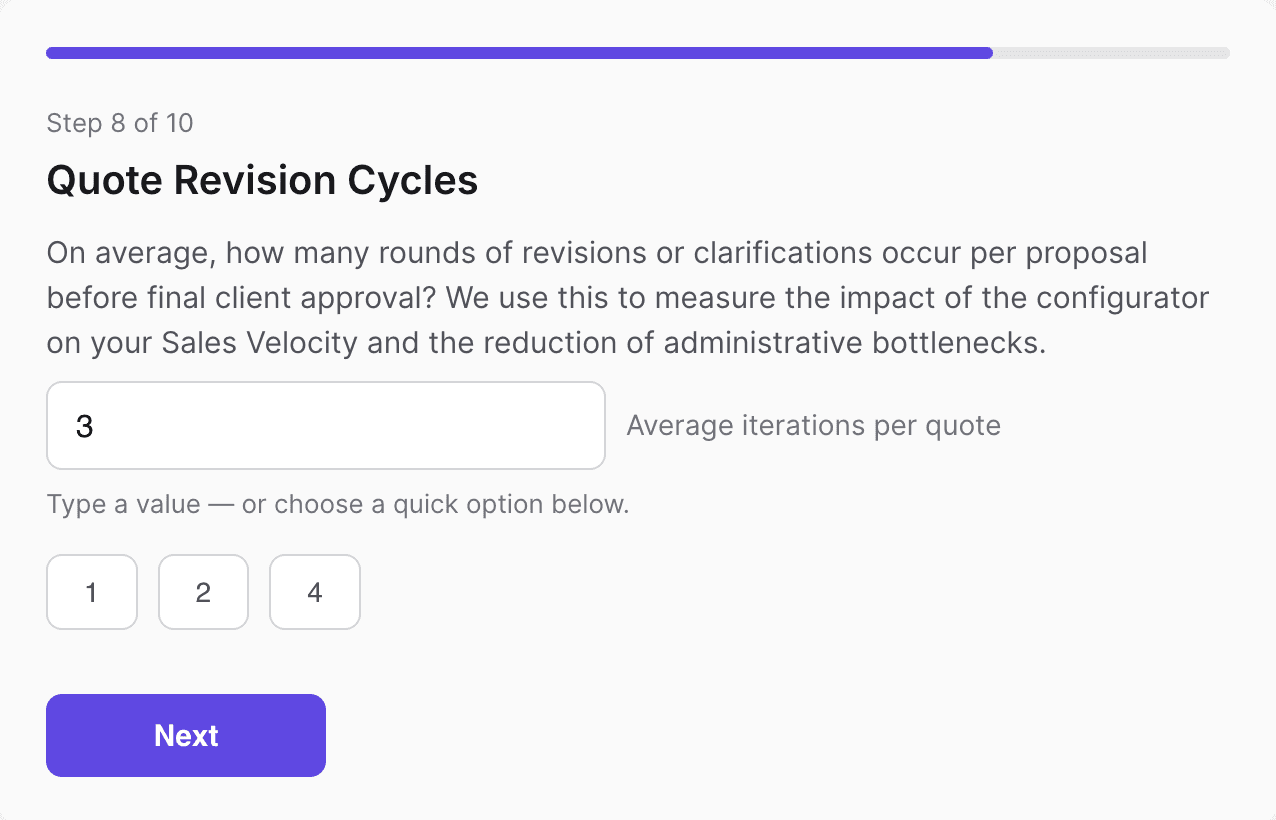
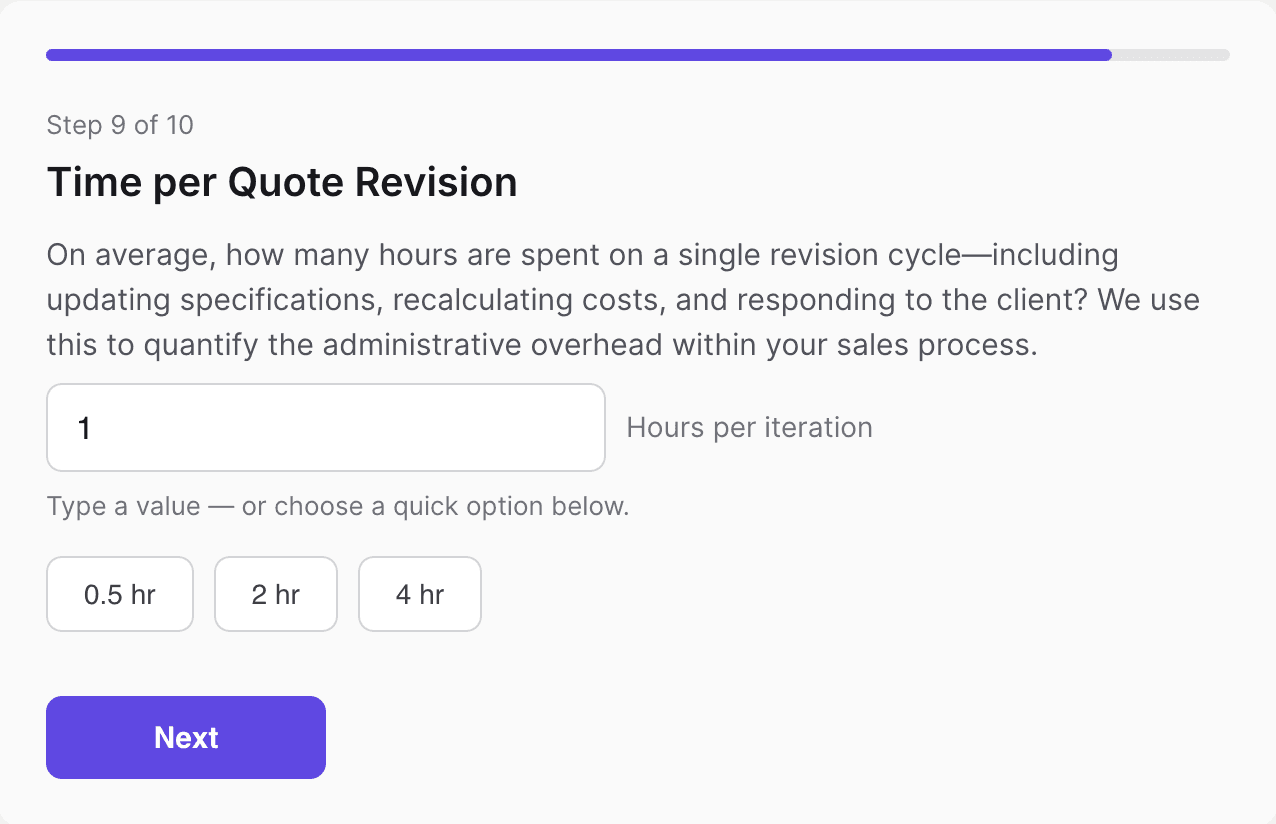
Step 8 and 9: The revision cycle
The "back-and-forth" cost. We input 3 rounds of revisions per proposal, with each revision taking 1 hour. This totals 9 hours of manual labor per successful sale.
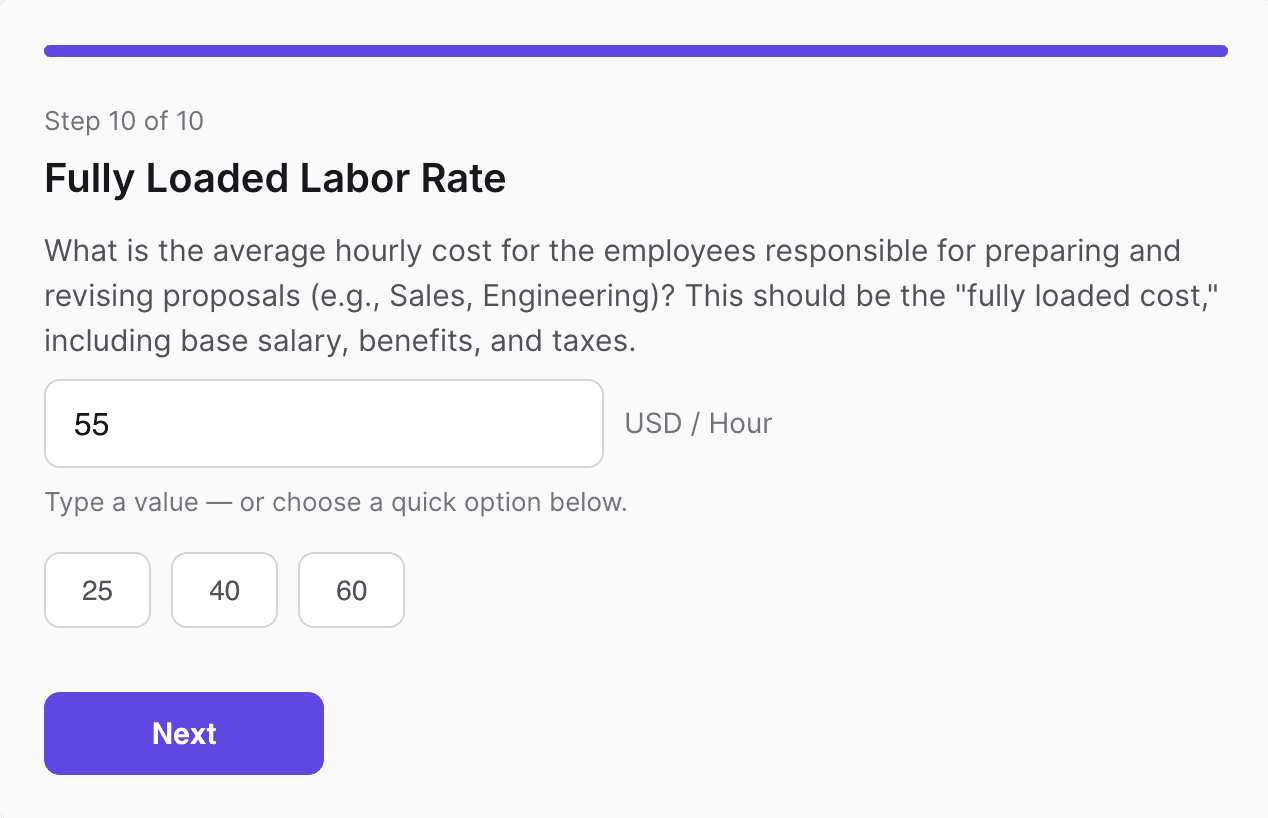
Step 10: Fully loaded labor rate
Finally, we input the total hourly cost of your team ($55/hr), including benefits. This allows the model to put a precise dollar value on the time reclaimed from manual administrative tasks, turning wasted hours into measurable savings.
Step 11: Finalization
The model then processes these 10 data points to compare your current manual sales process against an automated 3D workflow.
Getting the report
Once all 10 data points are entered, you simply provide your email to receive a comprehensive, personalized ROI report.

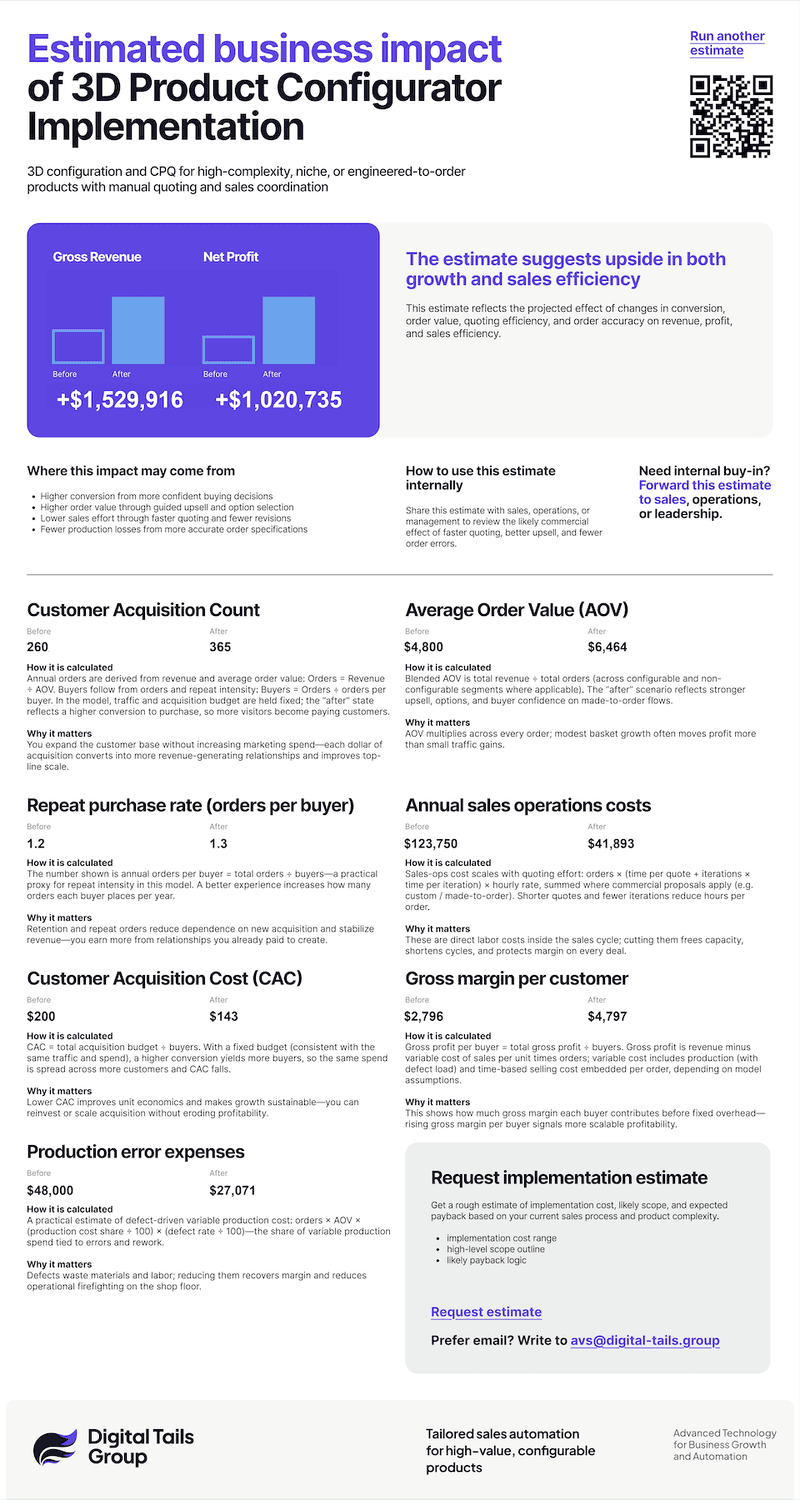
The PDF report
The final output is a professional PDF report that acts as a business case for your stakeholders. It visualizes the $1M+ net profit upside, compares your "before vs. after" economics side-by-side, and offers a direct path to request a detailed implementation estimate from the Digital Tails Group team.
Breaking down the results
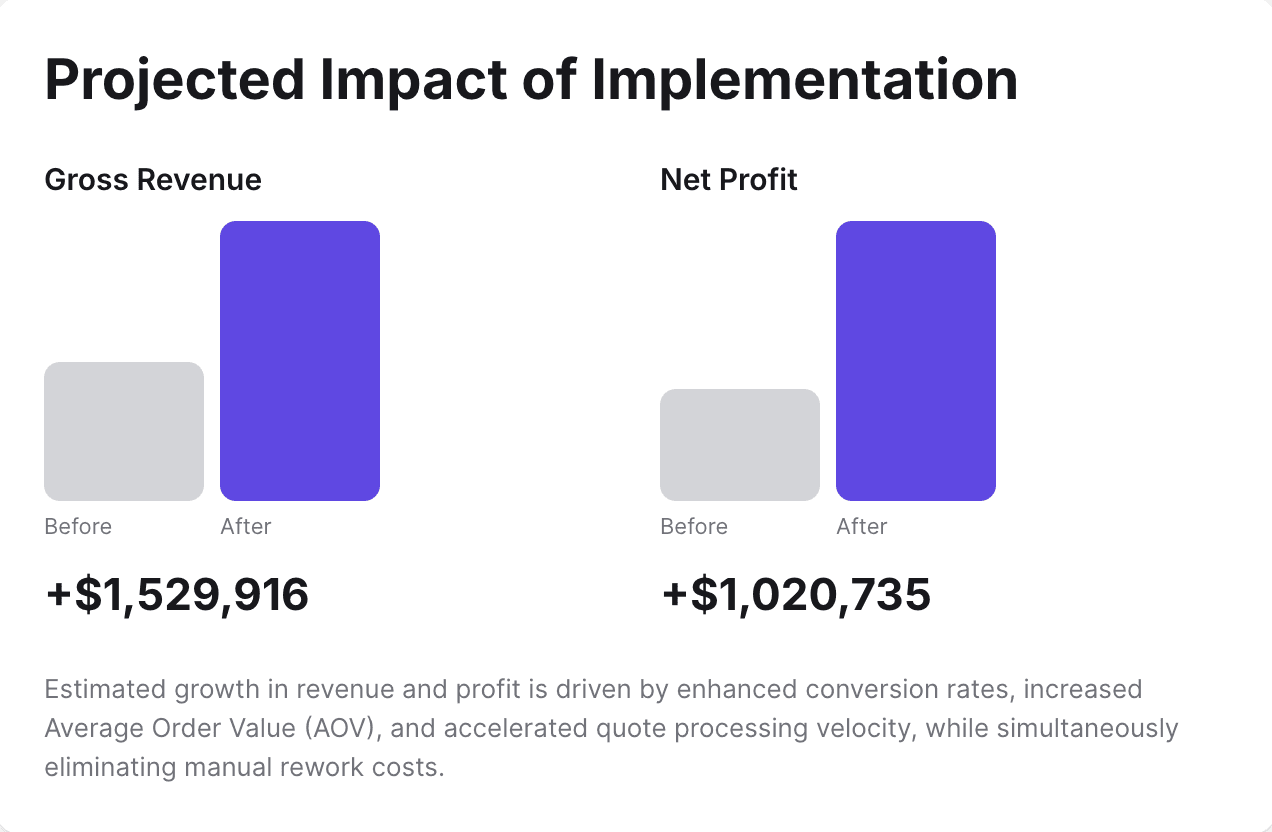
Revenue and profit
The model projects a massive increase in both scale and efficiency:
Gross revenue upside: +$1,529,916
Net profit upside: +$1,020,735
Gross margin per customer: Jumps from $2,796 to $4,797
Efficiency gains: slashing sales costs
The biggest change is found in Annual Sales Operations Costs.
Before: $123,750
After: $41,893
By automating the quoting logic, the business reclaims $81,857 in labor capacity that was previously wasted on manual data entry and revisions
Growth gains: conversion and acquisition
Because 3D visuals increase buyer confidence, the "After" state shows:
Customer count: Increases from 260 to 365 buyers annually
AOV growth: The average check rises from $4,800 to $6,464
CAC efficiency: The cost to acquire a customer drops from $200 to $143, making your marketing budget 28% more effective
Quality gains: reducing rework
By implementing automated logic (where a customer cannot choose an incompatible option), the Production Error Expenses are cut from $48,000 down to $27,071
The data speak clearly: the ROI of a 3D configurator is found in the intersection of increased sales confidence and decreased operational friction. Install a more profitable sales engine.
Ready to calculate your own upside? Visit the Digital Tails ROI Calculator